Editor’s Note: Hey team! Thanks for all the support. I enjoy putting together these notes as it helps keep me aware of narratives that may impact my own trades.
I’ll be taking the rest of the week off (i.e., no notes till Monday most likely), focusing on other areas of the business like prep for the weeks and months to come.
Take care and trade safe. - Renato
What Happened
A lot to unpack, today. Part of the newsletter may be cut off, as a result, in your inbox. Just click to view in another window.
Overnight, equity index futures auctioned sideways to lower while commodities, bonds, and implied volatility metrics were bid.
This is in the context of a global bond market rout. Central banks intend to tighten policy in light of surging inflation; investors are selling bonds and rotating into areas that have “better upside.”
Ahead is data on new home sales (10:00 AM ET). The Federal Reserve’s (Fed) Loretta Mester speaks at 10:00 AM ET. Mary Daly follows at 11:45 AM ET.
Moreover, yesterday’s commentary carried a pessimistic tone. In hindsight, too pessimistic. The reality is that this is a market environment like no other. Certain metrics that were very reliable carry little-to-no value (predictive ability) right now. This is true for those who base much of their decision-making on “fundamental” and “technical” analyses, too.
To combat this, we zoom out and look for trades that offer asymmetric payouts. We’re careful to provide liquidity when others demand it en masse. Similarly, we are to give ourselves room for error; stops are widened and lot sizes are smaller.
Read on for today’s lighter-hearted take on what’s happening and frameworks to trade on.

What To Expect
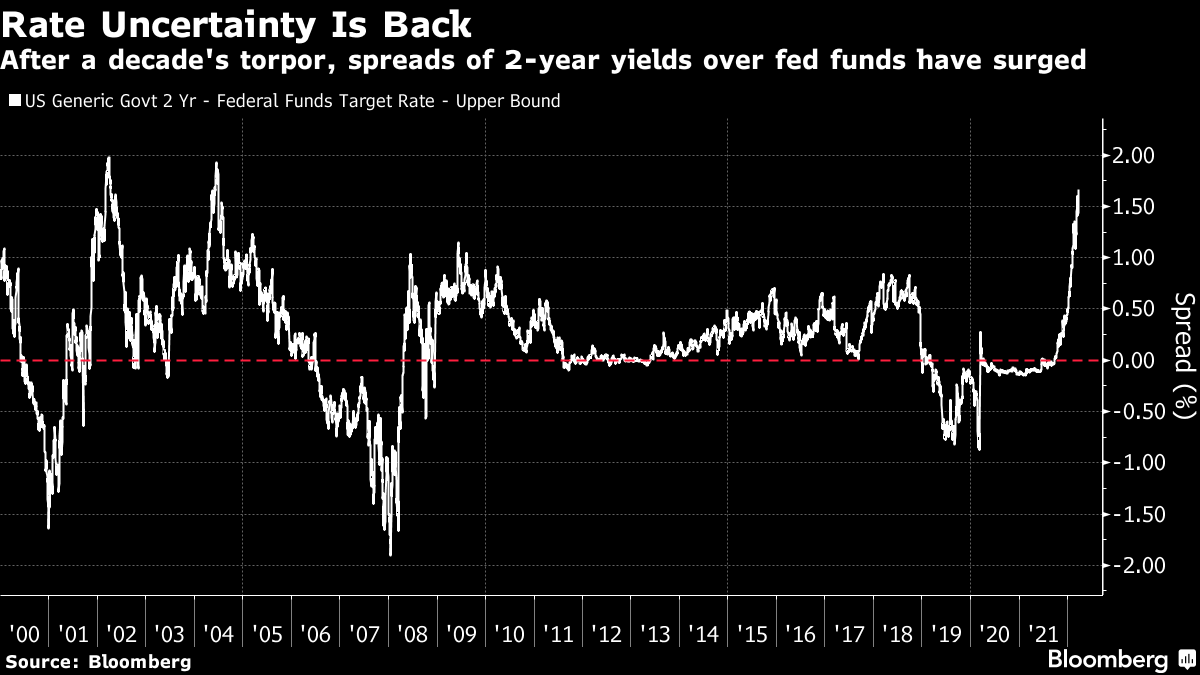
Fundamental: Bloomberg’s John Authers published a discussion on the performance of stocks, relative to bonds. Essentially, there have only been four previous two-week periods when stocks beat bonds by this much.

“All of the big positive moves were driven by classic stock market rebounds that proved to be durable. There was no particular move in bond yields. This is the first time a turn this dramatic has been pushed almost as much by falling bond prices as by rising stock prices.”

Authers explains that “equities are enjoying a false dawn as they’re recipients of the money coming out of bonds, and that we are about to be reacquainted with the bear markets in both bonds and stocks which come when rates [i.e., cost of money] have to rise to control inflation,” which impacts longer duration stocks (i.e., a stock whose value lies further in the future) most.

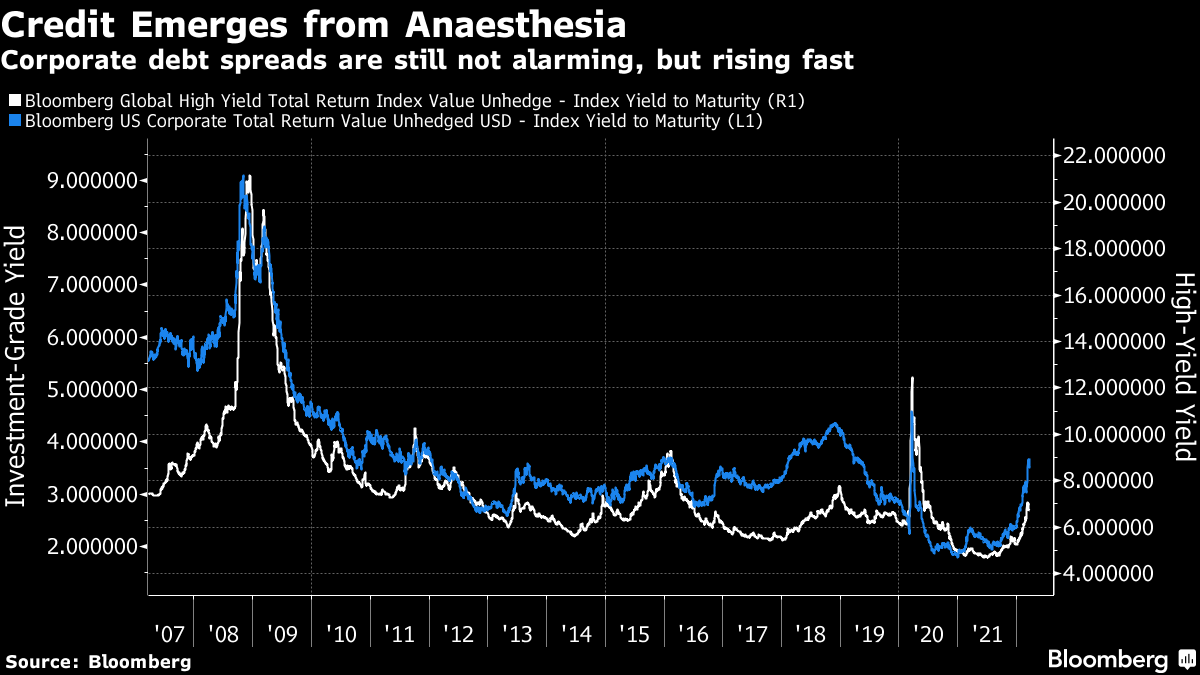
Adding, the impact of rising Treasury rates is magnified further when credit spreads (i.e., the difference in yield between bonds of similar maturities but different credit quality) also rise.

“The performance of stocks relative to bonds suggests we’re at the beginning of a big upswing; the absolute performance of bond yields in their own right suggests we need to bail out now before another crisis engulfs us,” Authers says.

Positioning: Dip buying serves investors well.

The near-vertical price rise in markets, over the last week, comes after a long period of weakness during which participants concentrated their activity in negative delta trades (which make money when markets trade lower, all else equal).
From a static delta perspective, now, there is both the covering of shorts and so-called macro buying (pointed to in the above section).
From a dynamic delta perspective, there are the implications of volatility compression (e.g., Cboe Volatility Index [INDEX: VIX] and term structure dropping), the removal of put-heavy exposures via last week’s options expiration (OPEX), and the market’s trade higher.

Taken together (short covering, macro buying, volatility compression, OPEX, and so on), the aforementioned dynamics bolster markets. It is the dynamics of positioning (demand or supply of liquidity) that magnify (add to) the velocity of moves up (or down).

Earlier this week, this newsletter pointed to the potential non-sustainability of the market’s rise. This was based on metrics that have provided tremendous predictive power, in the past.
Participants’ commitment to positive delta exposure (i.e., buying calls and selling puts), is a feature of sustained reversals. Data through Tuesday did not show this at the index level.
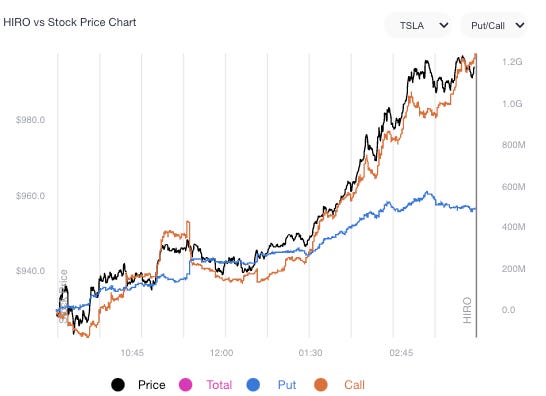
As discussed by SpotGamma, yesterday, in the S&P, participants bought puts and sold calls (i.e., a negative delta trade).
This was in the context of aggressive call buying and put selling in heavily weighted index constituents like Tesla Inc (NASDAQ: TSLA).

As stated in yesterday’s commentary, markets remain vulnerable to sharp drops. In the case of further volatility suppression (e.g., customer call and put selling), counterparties will tend toward supporting markets and laying the foundation for later-dated rallies.
However, if markets trade down and volatility rises, accordingly, as participants seek protection, the potential exists for magnified moves on the way down.
Straight up could well precede straight down. A bottom (as some strategists are calling for) may take time to hammer out.
Technical: As of 6:30 AM ET, Wednesday’s regular session (9:30 AM - 4:00 PM ET), in the S&P 500, will likely open in the lower part of a negatively skewed overnight inventory, inside of prior-range and -value, suggesting a limited potential for immediate directional opportunity.
In the best case, the S&P 500 trades higher; activity above the $4,489.75 low volume area (LVNode) puts in play the $4,515.25 LVNode. Initiative trade beyond the $4,515.25 LVNode could reach as high as the $4,548.75 LVNode and $4,565.00 untested point of control (VPOC), or higher.
In the worst case, the S&P 500 trades lower; activity below the $4,489.75 LVNode puts in play the $4,464.75 LVNode. Initiative trade beyond the $4,464.75 LVNode could reach as low as the $4,438.25 high volume area (HVNode) and $4,409.00 VPOC, or lower.
Considerations: Push-and-pull, as well as responsiveness near key-technical areas (that are discernable visually on a chart), suggests technically-driven traders with short time horizons are very active.
Such traders often lack the wherewithal to defend retests and, additionally, the type of trade may be indicative of the other time frame participants waiting for more information to initiate trades.
Click here to load today’s key levels into the web-based TradingView charting platform. Note that all levels are derived using the 65-minute timeframe. New links are produced, daily.
Definitions
Volume Areas: A structurally sound market will build on areas of high volume (HVNodes). Should the market trend for long periods of time, it will lack sound structure, identified as low volume areas (LVNodes). LVNodes denote directional conviction and ought to offer support on any test.
If participants were to auction and find acceptance into areas of prior low volume (LVNodes), then future discovery ought to be volatile and quick as participants look to HVNodes for favorable entry or exit.
POCs: POCs are valuable as they denote areas where two-sided trade was most prevalent in a prior day session. Participants will respond to future tests of value as they offer favorable entry and exit.
About
After years of self-education, strategy development, mentorship, and trial-and-error, Renato Leonard Capelj began trading full-time and founded Physik Invest to detail his methods, research, and performance in the markets.
Capelj also develops insights around impactful options market dynamics at SpotGamma and is a Benzinga reporter.
Some of his works include conversations with ARK Invest’s Catherine Wood, investors Kevin O’Leary and John Chambers, FTX’s Sam Bankman-Fried, Kai Volatility’s Cem Karsan, The Ambrus Group’s Kris Sidial, among many others.
Disclaimer
In no way should the materials herein be construed as advice. Derivatives carry a substantial risk of loss. All content is for informational purposes only.


