


Daily Brief | March 17, 2022
Daily commentary for U.S. broad market indices.
The Daily Brief is a free glimpse into the prevailing fundamental and technical drivers of U.S. equity market products. Join the 200+ that read this report daily, below!
What Happened
A lot to unpack, today. Part of the newsletter may be cut off, as a result, in your inbox. Just click to view in another window.
Overnight, equity index futures took back part of Wednesday’s advance after the Federal Open Market Committee (FOMC) made the decision to tighten, albeit at a more aggressive pace than previously expected.
Moreover, according to some reports, last night’s decline comes as the Kremlin rejected claims that Ukraine peace talks were making progress. Subsequently, most commodity products rose.
Ahead is data on jobless claims, building permits, housing starts, and the Philadelphia Fed manufacturing survey (8:30 AM ET). Later, participants receive data on industrial production and capacity utilization (9:15 AM ET).

What To Expect
Fundamental: In the face of a strong economy (at home) plagued by supply and demand imbalances, as well as geopolitical tensions and economic turmoil (abroad), the Federal Reserve (Fed) raised borrowing costs by a quarter percentage point and signaled six more in 2022 putting the policy rate at ~2.8% before 2024.

Bloomberg’s John Authers explains well what transpired. Essentially, not one FOMC member thought rates would exceed 2.25% by the end of 2023. Now, most members think rates may need to go as high as 3.75% to help rein in inflation and promote price stability.
“In addition to giving up on ‘lower for longer’ rates, the Fed also seems to be capitulating on its forecasts for inflation to come under control relatively swiftly,” Authers explains.
“There is no consensus. That is alarming, and prompted some to fear that the Fed was admitting it didn’t know what was going on.”

Ultimately, the FOMC thinks inflation will return to their 2% long-term target, and the fed funds rate may top out at 2.4%, “the lowest projection for long-term rates on record.”
In terms of asset purchases, the FOMC will have an updated quantitative tightening (QT) schedule as soon as May.
After the announcement, the U.S. equity market closed higher while 5-year yields topped 10-year yields for the first time in 15 years.
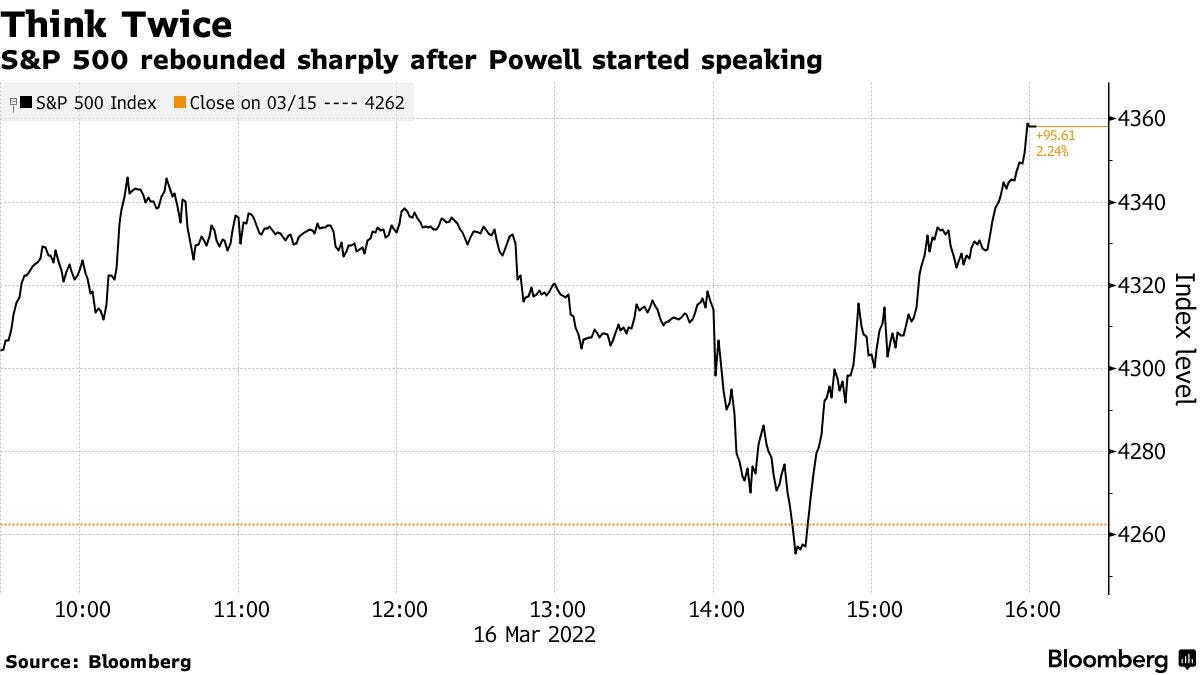
“It was the first time this relationship had inverted since early 2007, shortly before the beginning of the credit crisis,” Authers explained in statements as to the factors that may lead to the Fed abandoning its tightening schedule.

“Any inversion is a worrying sign, although one between five and 10 years, in the so-called ‘belly’ of the curve, is not as alarming as an inversion between three-month or two-year yields and the 10-year yield.”
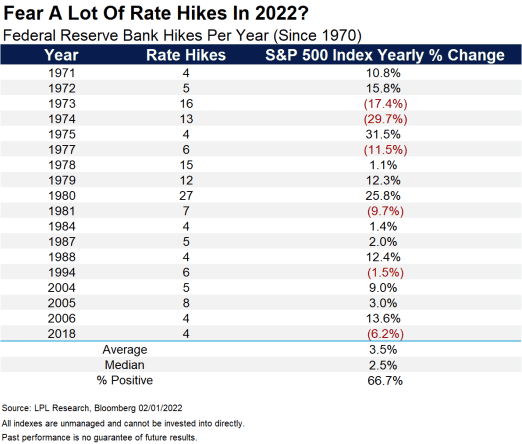
Moreover, according to stats compiled by LPL Research, stocks tend to do well after the Fed starts hiking rates.

“Fed rate hikes usually happen near the middle of the economic cycle, with potentially years left of gains in stocks and the economy,” explained LPL Financial’s Ryan Detrick.
“In fact, a year after the first hike in a cycle has been fairly strong, higher a year later the past six times.”
Positioning: Implied volatility metrics compressed markedly, yesterday, and this bolstered a near-vertical price rise in the equity market, as suggested would happen in past letters.

Checking out SpotGamma’s Hedging Impact of Real-Time Options (HIRO) indicator, we see little commitment by S&P 500 participants in this rally. Instead, the response was quite neutral.

Taking a look at some of the cash-settled indexes, like the growth- and tech-heavy Nasdaq 100 (INDEX: NDX), there was some notable buying of call spreads (i.e., positions that make money if the underlying moves higher, all else equal), though.

“Moreover, heading into Wednesday’s FOMC, we saw the market well-hedged,” SpotGamma explained. “Participants’ demand for protection is concentrated in options with little time to expiry (given the monthly options expiration and roll-off a significant size of S&P delta).”
“Adding, the compression of volatility today, coupled with trade higher, solicits less counterparty hedging of put protection … [and] less positive delta = less selling to hedge = less pressure.”

Ultimately, this post-FOMC price rise may put the market in an underhedged position. In such a case, as talked about yesterday, new demand for protection would add fuel to weakness (later).

Regardless, comparing buying and options positioning metrics, the returns distribution remains skewed positive (albeit much less so than before).
Technical: As of 6:30 AM ET, Thursday’s regular session (9:30 AM - 4:00 PM ET), in the S&P 500, will likely open in the middle-to-lower part of a negatively skewed overnight inventory, inside of prior-range and -value, suggesting a limited potential for immediate directional opportunity.
Spike Scenarios In Play: Spikes mark the beginning of a break from value. Spikes higher (lower) are validated by trade at or above (below) the spike base (i.e., the origin of the spike).
In the best case, the S&P 500 trades higher; activity above the $4,339.50 spike base puts in play the $4,375.00 untested point of control (VPOC). Initiative trade beyond the VPOC could reach as high as the $4,395.25 high volume area (HVNode) and $4,418.75 overnight high (ONH), or higher.
In the worst case, the S&P 500 trades lower; activity below the $4,339.50 spike base puts in play the $4,314.75 HVNode. Initiative trade beyond the $4,314.75 could reach as low as the $4,285.25 HVNode and $4,249.25 low volume area (LVNode), or lower.
Considerations: Push-and-pull, as well as responsiveness near key-technical areas (that are discernable visually on a chart), suggests technically-driven traders with short time horizons are very active.
Such traders often lack the wherewithal to defend retests and, additionally, the type of trade may be indicative of the other time frame participants waiting for more information to initiate trades.
Click here to load today’s key levels into the web-based TradingView charting platform. Note that all levels are derived using the 65-minute timeframe. New links are produced, daily.

Graphic: 65-minute profile chart of the Micro E-mini S&P 500 Futures.
Definitions
Overnight Rally Highs (Lows): Typically, there is a low historical probability associated with overnight rally-highs (lows) ending the upside (downside) discovery process.
Volume Areas: A structurally sound market will build on areas of high volume (HVNodes). Should the market trend for long periods of time, it will lack sound structure, identified as low volume areas (LVNodes). LVNodes denote directional conviction and ought to offer support on any test.
If participants were to auction and find acceptance into areas of prior low volume (LVNodes), then future discovery ought to be volatile and quick as participants look to HVNodes for favorable entry or exit.
POCs: POCs are valuable as they denote areas where two-sided trade was most prevalent in a prior day session. Participants will respond to future tests of value as they offer favorable entry and exit.
About
After years of self-education, strategy development, mentorship, and trial-and-error, Renato Leonard Capelj began trading full-time and founded Physik Invest to detail his methods, research, and performance in the markets.
Capelj is also a Benzinga finance and technology reporter interviewing the likes of Shark Tank’s Kevin O’Leary, JC2 Ventures’ John Chambers, FTX’s Sam Bankman-Fried, and ARK Invest’s Catherine Wood, as well as a SpotGamma contributor developing insights around impactful options market dynamics.
Disclaimer
Physik Invest does not carry the right to provide advice.
In no way should the materials herein be construed as advice. Derivatives carry a substantial risk of loss. All content is for informational purposes only.