


Daily Brief | December 6, 2021
Daily commentary for U.S. broad market indices.
What Happened
Overnight, equity index futures auctioned sideways to higher after Friday’s liquidation had the S&P 500 undercutting its 50-day simple moving average (SMA), a visual go/no-go level.
Strength shifted, again, to the Russell 2000 while the tech-heavy Nasdaq 100 was underwater. This comes as policymakers look to temper inflation with the tightening of monetary policy.
In regards to news, China’s central bank looked to boost liquidity for its slowing economy. It was also found that a new virus variant was not fueling a surge in hospitalizations; the U.S.’s adviser on the issue, Anthony Fauci, said there wasn’t “a great degree of severity to omicron.”
That didn’t stop the economists at Goldman Sachs Group Inc (NYSE: GS) from cutting their forecasts for U.S. GDP next year; the estimates were revised down on an expectation the omicron strain would drag growth.
Ahead are no important releases on fundamental data.

What To Expect
On weak intraday breadth and divergent market liquidity metrics, the worst outcome occurred; there was an expansion of range, to the downside, and participants spent the majority of the session building value at lower prices (i.e., levels at which 70% of that day’s volume occurred).
The lower bound of Friday’s range was $4,500.00 or so, at which the 50-day SMA corresponded with a large base of resting liquidity.
To note, the 50-day is visual level at which short-term, technically-driven participants were likely buying in response to probes below developing balance.
Successfully auctioning beneath the 50-day is a concern. Those short-term participants lack the wherewithal (both emotional and financial) to defend retests.
Continuation lower, in such a case, is likely.

Context: The Fed’s intent to moderate stimulus and uncertainty with regards to how a new COVID-19 variant will impact the global recovery.
According to Bloomberg, “the Fed is seen responding to the inflation fears stalking businesses by leaning toward an older playbook of prioritizing the fight against price pressures -- even if that risks weaker growth over the longer term.”
In line with the aforementioned, traders already started pricing in potential rate overshoots with the “December 2024 eurodollar yields [rising] above December 2025 contracts, a curve inversion that signals expectations the central bank may consider cutting rates in 2025.”
The result is that the U.S. may realize the swiftest tightening in financial conditions since 2005 if the Fed was to hike rates three times next year.
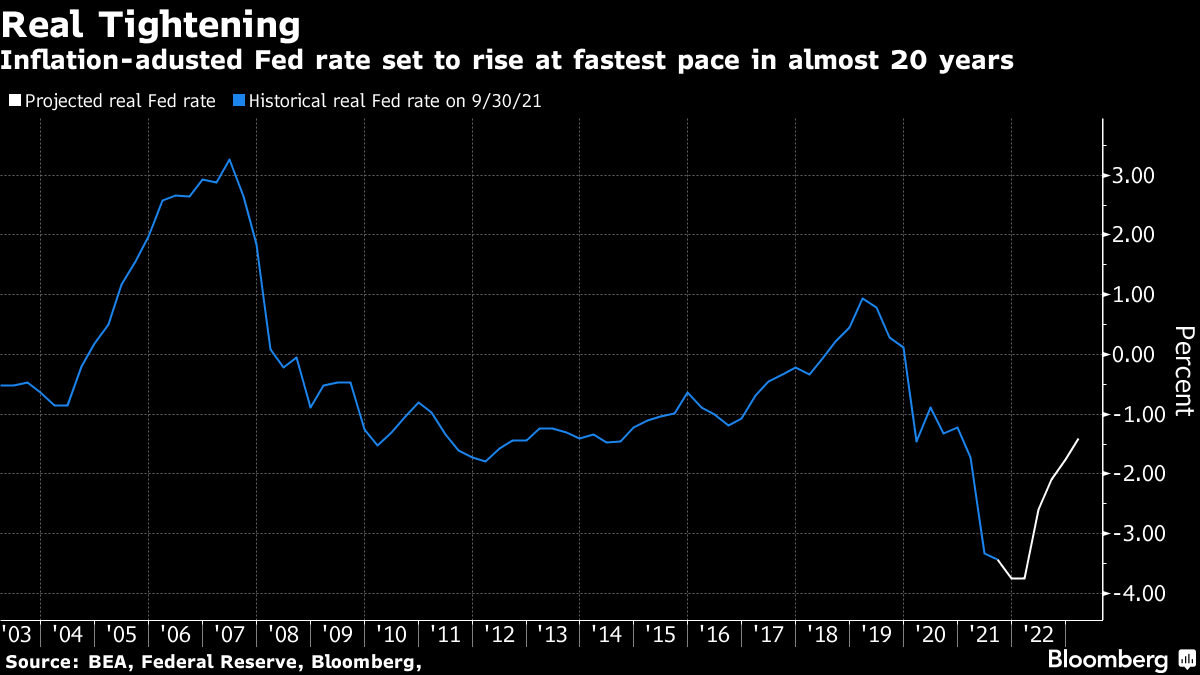
This development carries weight; now, more than during the tech-and-telecom bubble, low rates support current valuations.

The reason being?
“Lower interest rates lead to future cashflow discounting less – leading to higher valuations. From another perspective, a company with a 5% profit margin is a much more attractive investment when long-term borrow costs are less than 2%, as they are now than when it costs 5%-7% to borrow money back in the ‘90s.”
The Fed’s intent to taper faster, and eventually hike rates, just as liquidity conditions have deteriorated, pushed “the orange dot [in the above graphic] toward the right during the year.”
Notwithstanding, “growth in earnings is so far stronger than the multiple compression caused by rising rates (blue line),” and that is helping support this year’s rally.
The intent to moderate stimulus is likely to serve as a headwind; there’s always a possibility of unanticipated policy adjustments, in the face of a resurgent COVID-19 digging further into the economy’s growth.
That’s partially why we saw Goldman Sachs cut their forecasts for GDP.
But, for every negative view, there is a positive (either by the same institution or a competitor).
We see JPMorgan Chase & Co (NYSE: JPM), among others, doubling down on their bullishness.
“We are calling for another year of positive earnings surprises, relative to current consensus estimates.”
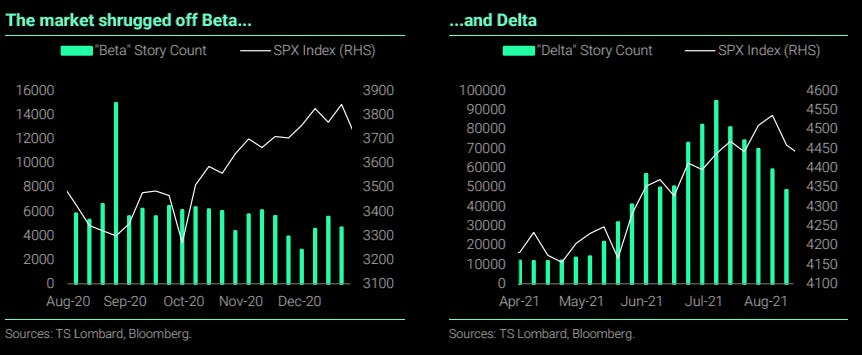
Similarly, the market may shrug off omicron just as it did beta and delta.
And, despite the market’s trade in short-gamma (a “negative [gamma] implies the opposite [selling into lows, buying into highs], thus magnifying market volatility”) destabilizing demand for downside protection is concentrated in shorter-dated options.

Once that short-dated protection rolls off the table (and/or is monetized), counterparties will quickly reverse and support the market, buying to close their existing stock/futures hedges.
This flow is stabilizing and may play into a seasonally-aligned rally into Christmas as participants see defenses rolled out against the new COVID-19 variant, and the positive effects of pro-cyclical inflation, economic growth, and improvements in global trade.
Such development plays into a thesis held by Moody’s Corporation (NYSE: MCO).
“The forecast is that the Dow Jones Industrial Average increases this quarter and peaks in early 2022. However, the rest of the contours of the forecast didn’t change. We expect the DJIA to steadily decline throughout 2022, but because it will now peak later than previously thought, the level of the DJIA will be higher at the end of next year and over the near-term forecast.”
Similarly, here are some views by Morgan Stanley (NYSE: MS), compiled by The Market Ear.
“The Morgan Stanley's Global Risk Demand Index (GRDI) [fell] to a 10Y low reading of -4.2SD, last Friday (currently -3.SD). Historically, such a level has proved to be a solid buy signal over the next 3m. Other signs that investor sentiment has overshot to the downside include the VIX > 30, a steep put-call skew, and the AAII survey where 42% of respondents are bearish (90th percentile reading). Over the last decade, MSCI ACWI has risen 98% of the time over the next 3m post this signal and by an average of 10%.”
Expectations: As of 6:30 AM ET, Monday’s regular session (9:30 AM - 4:00 PM ET), in the S&P 500, will likely open in the middle part of a positively skewed overnight inventory, inside of prior-range and -value, suggesting a limited potential for immediate directional opportunity.
Balance-Break Scenarios: A change in the market (i.e., the transition from two-time frame trade, or balance, to one-time frame trade, or trend) may occur.
Monitor for acceptance (i.e., more than 1-hour of trade) outside of the developing balance area. Rejection (i.e., return inside of balance) portends a move to the opposite end of the balance.
In the best case, the S&P 500 trades sideways or higher; activity above the $4,523.00 untested point of control (VPOC) puts in play the $4,551.75 low volume area (LVNode). Initiative trade beyond the LVNode could reach as high as the $4,574.25 high volume area (HVNode) and $4,590.00 balance area high (BAH), or higher.
In the worst case, the S&P 500 trades lower; activity below the $4,523.00 VPOC puts in play the $4,492.25 regular trade low (RTH Low). Initiative trade beyond the RTH Low could reach as low as the $4,471.00 and $4,425.00 VPOC, or lower.
Click here to load today’s updated key levels into the web-based TradingView charting platform. Note that all levels are derived using the 65-minute timeframe. New links are produced, daily.

Definitions
Volume Areas: A structurally sound market will build on areas of high volume (HVNodes). Should the market trend for long periods of time, it will lack sound structure, identified as low volume areas (LVNodes). LVNodes denote directional conviction and ought to offer support on any test.
If participants were to auction and find acceptance into areas of prior low volume (LVNodes), then future discovery ought to be volatile and quick as participants look to HVNodes for favorable entry or exit.
Liquidation Breaks: The profile shape suggests participants were “too” long and had poor location.
POCs: POCs are valuable as they denote areas where two-sided trade was most prevalent in a prior day session. Participants will respond to future tests of value as they offer favorable entry and exit.
About
After years of self-education, strategy development, and trial-and-error, Renato Leonard Capelj began trading full-time and founded Physik Invest to detail his methods, research, and performance in the markets.
Additionally, Capelj is a Benzinga finance and technology reporter interviewing the likes of Shark Tank’s Kevin O’Leary, JC2 Ventures’ John Chambers, and ARK Invest’s Catherine Wood, as well as a SpotGamma contributor, developing insights around impactful options market dynamics.
Disclaimer
At this time, Physik Invest does not manage outside capital and is not licensed. In no way should the materials herein be construed as advice. Derivatives carry a substantial risk of loss. All content is for informational purposes only.