


Daily Brief | August 31, 2021
Daily commentary for U.S. broad market indices.
Market Commentary
Equity index futures, VIX sideways to higher. Commodities, bonds, dollar lower.
Ahead: Home prices, PMI, and more.
The path of least resistance is higher.
What Happened: U.S. stock index futures auctioned sideways to higher overnight alongside an absence in fundamental catalysts.
Ahead is data on the Case-Shiller national home price index (9:00 AM ET), Chicago PMI (9:45 AM ET), and consumer confidence index (10:00 AM ET).

What To Expect: As of 6:30 AM ET, Tuesday’s regular session (9:30 AM - 4:00 PM EST) in the S&P 500 will likely open inside of prior-range and -value, suggesting a limited potential for immediate directional opportunity.
Adding, during the prior day’s regular trade, on weak intraday breadth and middling market liquidity metrics, the best case outcome occurred, evidenced by further price discovery.
Price Discovery (One-Timeframe Or Trend): Market seeking new prices to establish value, or acceptance (i.e., more than 30-minutes of trade at a particular price level).
Despite the low volume, p-shaped profile structures (which denote short covering), and a lack of intraday range expansion, the aforementioned trade is significant because it suggests continued bullishness after a v-pattern recovery.
V-Pattern: A pattern that forms after a market establishes a high, retests some support, and then breaks above said high. In most cases, this pattern portends continuation.
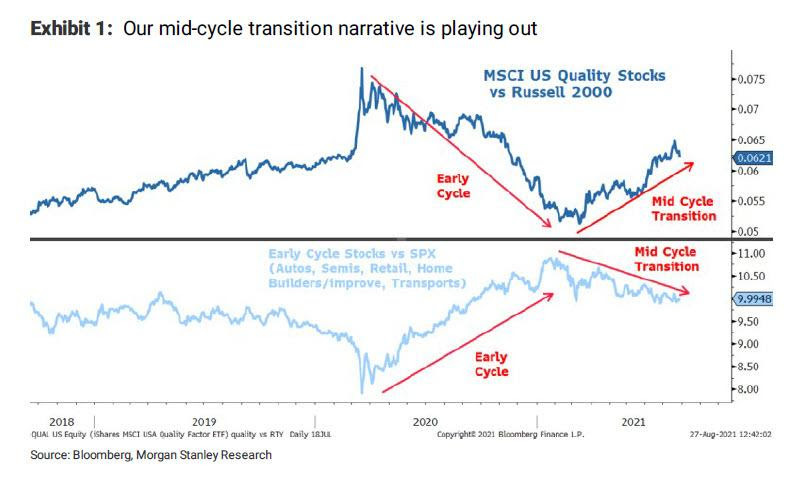
Further, the aforementioned trade is happening in the context of non-seasonally aligned inflows, impactful options market dynamics, divergent sentiment, and fears of a mid-cycle transition.
The implications of these themes on price are contradictory; to elaborate, on one hand, August, over the past 25 years, has historically been the largest month for equity outflows. According to Goldman Sachs Group Inc’s (NYSE: GS) Scott Rubner, “We have seen none of these outflows and it has been buying the dip (TINA).”
Given this divergence from the norm, an advance (such as the one we’re in presently) is not “welcomed and may lead to a quick right tail edging … [as] option volume notional is 120% of stock volume notional.”
To put it simply, 75% of the options being traded expire within two weeks. The related hedging flows of these directionally sensitive options can represent an increased share of volume in underlying stocks.
To put it simply, option flows impact the underlying’s price, markedly.
We couple this so-called right-tail hedging with the structural positioning that drives the market through the three factors – the change in the underlying price (gamma), implied volatility (vanna), and time (charm) – that are well known to impact an options exposure to directional risk or delta.
“Charm is a major driver for support in the markets,” said Cem Karsan of Kai Volatility Advisors. “All of that support is leading up to and accelerating into that Monday-Wednesday window” ahead of OpEx. “And then the window really opens for lack of support. It’s not like there’s a bunch of selling all of a sudden. It’s a window of non-strength; a lack of these supportive flows that have been there prior.”


With the August monthly options expiration (OPEX) behind, the focus shifts to September, at and around the same time Morgan Stanley’s (NYSE: MS) Michael Wilson expects a formal signal – which would align with Karsan’s window of non-strength – on the taper of asset purchases, leading to a mid-cycle transition and 10% S&P 500 correction.
Options Expiration (OPEX): Option expiries mark an end to pinning (i.e, the theory that market makers and institutions short options move stocks to the point where the greatest dollar value of contracts will expire worthless) and the reduction dealer gamma exposure.
“Assuming a stable equity risk premium at 345bp, P/Es would fall to 19x, or 10% lower.”
Moreover, for today, participants may make use of the following frameworks.
In the best case, the S&P 500 trades sideways or higher; activity above the $4,524.00 low volume area (LVNode) pivot puts in play the $4,542.25 overnight high (ONH). Initiative trade beyond the ONH could reach as high as the $4,556.25 and $4,592.25 Fibonacci extensions.
In the worst case, the S&P 500 trades lower; activity below the $4,524.00 LVNode puts in play $4,510.00, the convergence of a regular-trade high and LVNode. Initiative trade beyond the $4,510.00 figure could reach as low as the $4,481.75 high volume area (HVNode) and $4,454.25 LVNode.
To note, the $4,454.25 LVNode corresponds with an anchored volume-weighted average price (VWAP), a metric highly regarded by chief investment officers, among other participants, for quality of trade. Additionally, liquidity algorithms are benchmarked and programmed to buy and sell around VWAPs.
Overnight Rally Highs (Lows): Typically, there is a low historical probability associated with overnight rally-highs (lows) ending the upside (downside) discovery process.
Volume Areas: A structurally sound market will build on past areas of high volume. Should the market trend for long periods of time, it will lack sound structure (identified as a low volume area which denotes directional conviction and ought to offer support on any test).
If participants were to auction and find acceptance into areas of prior low volume, then future discovery ought to be volatile and quick as participants look to areas of high volume for favorable entry or exit.

News And Analysis
Inventories continue to constrain home purchase activity.
The Fed now risking too-slow taper after too-fast in 2013.
A fast lane for the ECB to taper purchases ahead of Fed.
OPEC+ faces mixed market signals after U.S. pressures.
Capital raises from infotech sector simmering down July.
Fitch Ratings unpacks commodities and energy research.
Battery storage capacity likely to double inside California.
Moderna creates twice as many antibodies as Pfizer vax.
What People Are Saying


About
After years of self-education, strategy development, and trial-and-error, Renato Leonard Capelj began trading full-time and founded Physik Invest to detail his methods, research, and performance in the markets.
Additionally, Capelj is a finance and technology reporter. Some of his biggest works include interviews with leaders such as John Chambers, founder and CEO, JC2 Ventures, Kevin O’Leary, businessman and Shark Tank host, Catherine Wood, CEO and CIO, ARK Invest, among others.
Disclaimer
At this time, Physik Invest does not manage outside capital and is not licensed. In no way should the materials herein be construed as advice. Derivatives carry a substantial risk of loss. All content is for informational purposes only.