Market Commentary
Equity index futures are sideways and divergent.
Senate passes new $3.5T economic blueprint.
Ahead: Data on CPI, Federal Budget Balance.
Sideways chop as participants position for CPI.
What Happened: U.S. stock index futures auctioned sideways ahead of data that would provide clarity on the direction of consumer prices.
According to Moody’s: “The CPI rose 0.9% in June, but it likely moderated in July, since we don’t expect used car prices to have risen as quickly as they have recently. Elsewhere on the inflation front, we will get data on producer and import prices. After the release of the CPI and PPI, we will have a good idea of what the core PCE deflator, the Fed’s preferred measure of inflation, did in June.”
Ahead is also data on the Federal Budget Balance and Fed speak.

What To Expect: As of 6:45 AM ET, Wednesday’s regular session (9:30 AM - 4:00 PM EST) in the S&P 500 will likely open inside of prior-range and -value, suggesting a limited potential for immediate directional opportunity.
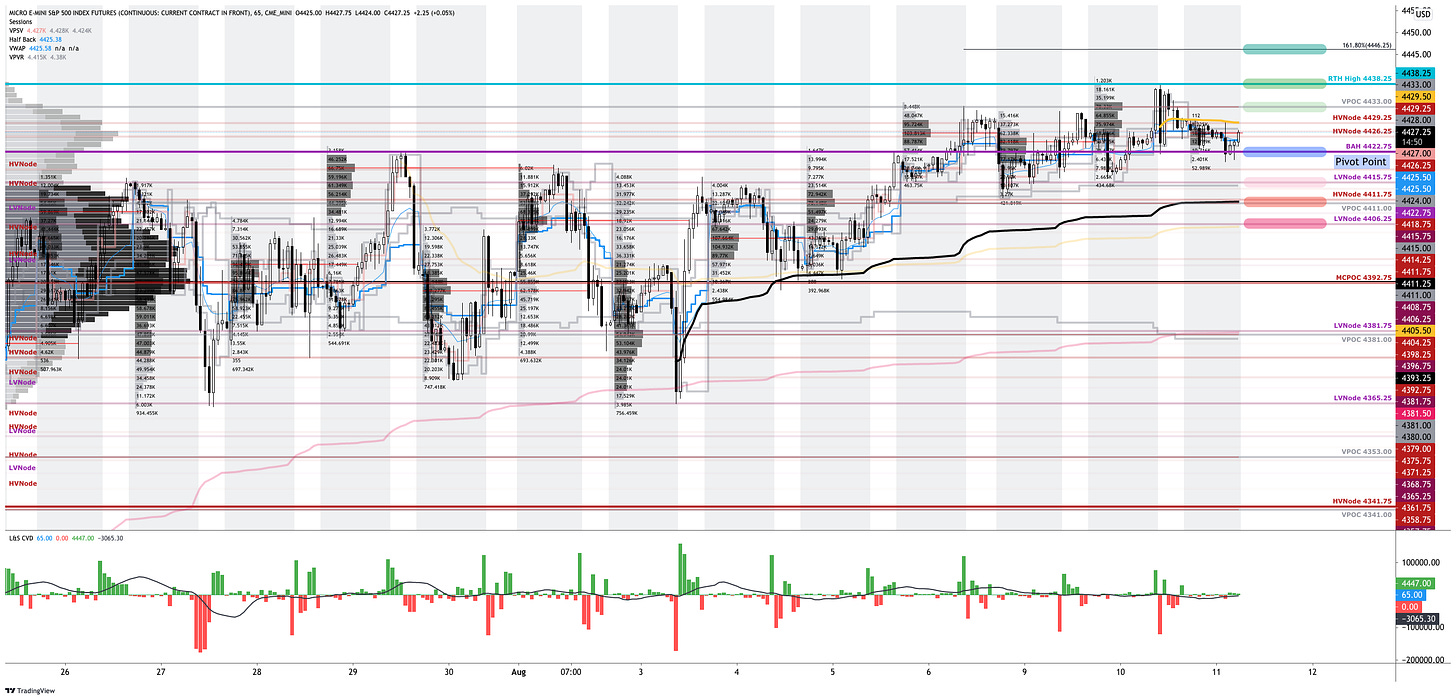
Adding, during the prior day’s regular trade, the best case outcome occurred, evidenced by initiative trade above the $4,422.75, a prior balance area high (BAH), up to the $4,438.50 Fibonacci extension.
Initiative Buying (Selling): Buying (selling) within or above (below) the previous day’s value area.
Balance (Two-Timeframe Or Bracket): Rotational trade that denotes current prices offer favorable entry and exit. Balance-areas make it easy to spot a change in the market (i.e., the transition from two-time frame trade, or balance, to one-time frame trade, or trend).
This advance happened in spite of top-line divergences, as well as lackluster metrics with respect to market liquidity and breadth.
Unlike on the NYSE side of things (which sported positive breadth with an inflow into stocks that were up versus down), internals on the Nasdaq were markedly weak with negative breadth supporting a liquidation in the Nasdaq 100 (INDEX: NDX).
In terms of market liquidity, the cumulative volume delta – a measure of buying and selling power as calculated by the difference in volume traded at the bid and offer – revealed no actionable divergences.
Coming into today’s Consumer Price Index (CPI) release, participants will notice the S&P 500, in particular, trading within a 3-day balance area, above a prior 10-day balance area. In short, since last week’s breakout, little has changed. What was thought would happen (i.e., expansion of range) didn’t happen.
Instead, trade was volatile, establishing excess just a tick short of the $4,438.50 Fibonacci extension as participants likely worked to position themselves for the mid-week data dump. As a result, until after the first couple of impulses on the CPI release, participants are cautioned on early trade.
Excess: A proper end to price discovery; the market travels too far while advertising prices. Responsive, other-timeframe (OTF) participants aggressively enter the market, leaving tails or gaps which denote unfair prices.
Moreover, for today, participants can trade from the following frameworks.
In the best case, the S&P 500 trades sideways or higher; activity above the $4,422.75 BAH likely puts in play the $4,433.00 untested point of control (VPOC). Initiative trade beyond the VPOC could reach as high as the $4,438.25 regular trade high (RTH High) and $4,446.25 Fibonacci extension.
In the worst case, the S&P 500 trades lower; activity below the $4,422.75 BAH likely puts in play the $4,415.75 low volume area (LVNode). Initiative trade beyond the LVNode could reach as low as the $4,411.00 VPOC and $4,406.25 LVNode.
Volume Areas: A structurally sound market will build on past areas of high volume. Should the market trend for long periods of time, it will lack sound structure (identified as a low volume area which denotes directional conviction and ought to offer support on any test).
If participants were to auction and find acceptance into areas of prior low volume, then future discovery ought to be volatile and quick as participants look to areas of high volume for favorable entry or exit.
Significance Of Prior ATHs, ATLs: Prices often encounter resistance (support) at prior highs (lows) due to the supply (demand) of old business. These areas take time to resolve. Breaking and establishing value (i.e., trading more than 30-minutes beyond this level) portends continuation.
POCs: POCs are valuable as they denote areas where two-sided trade was most prevalent. Participants will respond to future tests of value as they offer favorable entry and exit.
News And Analysis
Earnings historically strong and policy transition.
Hackers steal $600M in likely largest DeFi theft.
Economic activity restart is real and broadening.
A turning point for markets meriting a hard look.
Biden administration to urge OPEC output boost.
The Senate passed a $550B infrastructure plan.
Delta forces hospitals to ration scarce ICU beds.
Mortgage applications rise with rates below 3%.
A systemic cyberattack presents risks for banks.
What People Are Saying




About
After years of self-education, strategy development, and trial-and-error, Renato Leonard Capelj began trading full-time and founded Physik Invest to detail his methods, research, and performance in the markets.
Additionally, Capelj is a finance and technology reporter. Some of his biggest works include interviews with leaders such as John Chambers, founder and CEO, JC2 Ventures, Kevin O’Leary, businessman and Shark Tank host, Catherine Wood, CEO and CIO, ARK Invest, among others.
Disclaimer
At this time, Physik Invest does not manage outside capital and is not licensed. In no way should the materials herein be construed as advice. Derivatives carry a substantial risk of loss. All content is for informational purposes only.


